In a perfect software development environment, an engineer can design, develop, and debug on a single system. Conveniently, building and debugging a project can be accomplished a single key stroke: for example, pressing F5 in Microsoft’s Visual Studio. Unfortunately, many projects do not allow for local debugging. Some examples of this:
- Resolving bugs which only occur on specific systems
- Developing for a project which only runs on an operating system which is not a beneficial development system (e.g. Windows Home Server or simply an older version of Microsoft Windows such as Windows Vista or Windows XP)
While most software projects allow for simplified build and debug options via a software test-harness project or limited project build. There are typically times when remote debugging is required. Fortunately, Visual Studio offers a very robust remote debugger feature.
Requirements:
- Microsoft Visual Studio 2013, 2010, 2008, or 2005 (VS Express not supported)
- Remote Tools for Visual Studio
- A host (development) PC running Windows and Visual Studio
- A target (debug) PC running Windows
- Your software project, symbol files, and source code
One-time setup of host system:
Setting up the host system is fairly easy. Simply install Visual Studio, which should already be installed if you’re using your existing development system then configure the firewall to allow network communication between the host and the remote systems. Here are the three typical firewall options you have:
- If you do not have a firewall installed then there is nothing to do.
- If you are running a third-party firewall such as Norton Internet Security then simply disable the firewall temporarily during remote debugging. This is my personal preference since I rarely remote debug and I prefer not to permanently open ports in my firewall. I accomplish this by right-clicking on Norton Internet Security located in the tray icon and select Disable Smart Firewall and then select “15 minutes.” This usually provides me enough time to debug and it also automatically re-enables the firewall in case I forget. You can always disable the firewall for extended times if debugging is taking longer than expected
- If you’re running Windows built-in firewall then type “firewall” in Windows search to locate and run “Windows Firewall with advanced security” then create the following rules

- Allow Visual Studio application: Inbound Rules (on left side) | New Rule (on right-side) | Program | This program path | locate the path to your Visual Studio dev e.g. %VSInstallDirectory%\Common7\IDE\devenv.exe | Allow the Connection | Domain=checked, Private=checked, Public=checked | provide any rule name you wish
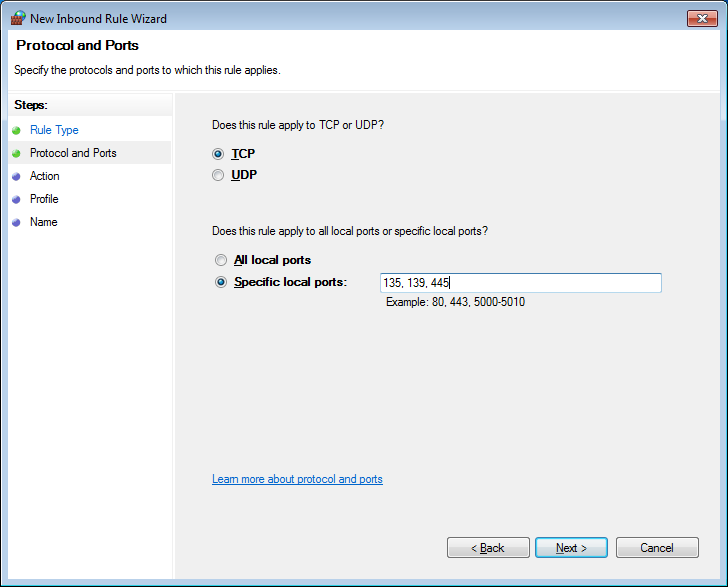
- Allow DCOM services on port 135: Inbound Rules (on left side) | New Rule (on right-side) | Port | TCP | Specific Local Ports = 135 | Allow the Connection | Domain=checked, Private=checked, Public=checked | provide any rule name you wish
- Allow IPSec services on ports 500 and 4500: Inbound Rules (on left side) | New Rule (on right-side)| Port | UDP | Specific Local Ports = 500,4500 | Allow the Connection | Domain=checked, Private=checked, Public=checked | provide any rule name you wish
See the “One-time setup of remote system” below for example screen-shots of the firewall wizard. Now your host system is all configured. Now it’s time to configure the remote system.
One-time setup of remote system:
The initial setting up the remote system involves opening ports in your firewall for communication and providing privileges to the Remote Debugging Monitor utility.
First, locate the Remote Debugging Monitor utility. This is included with the Visual Studio install set. Two versions of the utility are included, one for debugging on 32-bit applications (x86) and a second for debugging 64-bit applications (x64). The utilities are found on the installation drive under the Visual Studio install folder (for example, Visual Studio 2010 can be found here %SystemDrive%\Program Files (x86)\Microsoft Visual Studio 10.0\Common7\IDE\Remote Debugger). If you do not have this folder in your Visual Studio install-set then you can re-install Visual Studio and select “All Components.”
The two versions of the Remote Debugging Monitor will be located in their x86 folder (for 32-bit) and x64 folder (for 64-bit). For example, for Visual Studio 2010:
- C:\Program Files (x86)\Microsoft Visual Studio 10.0\Common7\IDE\Remote Debugger\x64
- C:\Program Files (x86)\Microsoft Visual Studio 10.0\Common7\IDE\Remote Debugger\x86
Which version of the utilities do you need? You’ll need to install the version which matches the “bit-ness” of the application you are debugging. Examples:
- Debugging a 32-bit application on a 64-bit target system: use x86
- Debugging a 32-bit application on a 32-bit target system: use x86
- Debugging a 64-bit application on a 64-bit target system: use x64
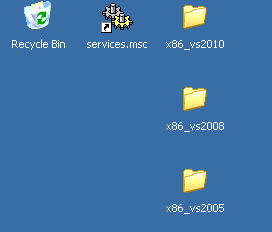
Copy the entire utilities folder (either “x86” or “x64”) from the Visual Studio folder to a folder of your choice on your remote debugging system. I prefer to copy the folder directly to the Desktop and then rename the folder to identify the version of Visual Studio the tools came from as well as the “bit-ness” (for example x86_vs2010, x64_vs2013, x86_2005, etc).
Configuring the firewall is very simple by letting the Microsoft msvsmon.exe utility configure itself on first-run. To do so, launch msvsmon.exe on the remote debugging system. You will be prompted, “do you want to automatically configure the firewall?” Select Yes, and all the ports and privileges will be configured for you. If you find this is not working or you want to configure the firewall manually then follow the following steps (otherwise continue to the next section, “Configuring a debug session”). Here are two common options to configure the firewall on the remote system:
- If you do not have a firewall installed then there is nothing to do.
- If you’re running Windows built-in firewall then type “firewall” in Windows search to locate and run “Windows Firewall with advanced security” then create the following rules
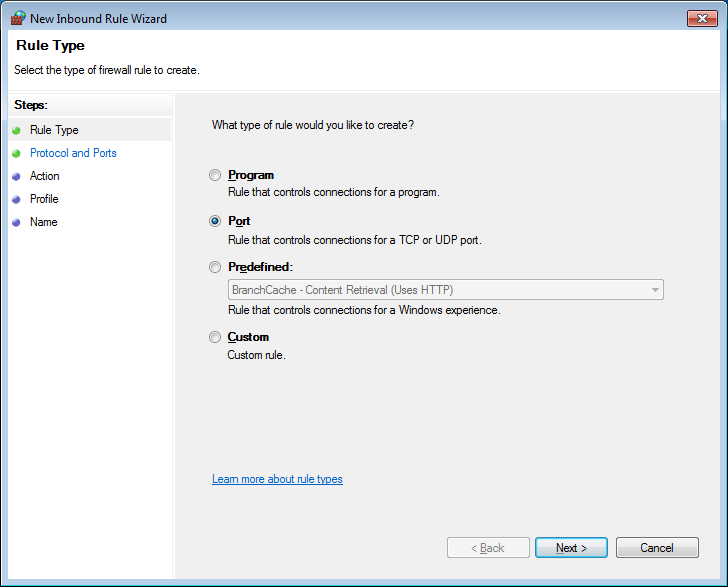
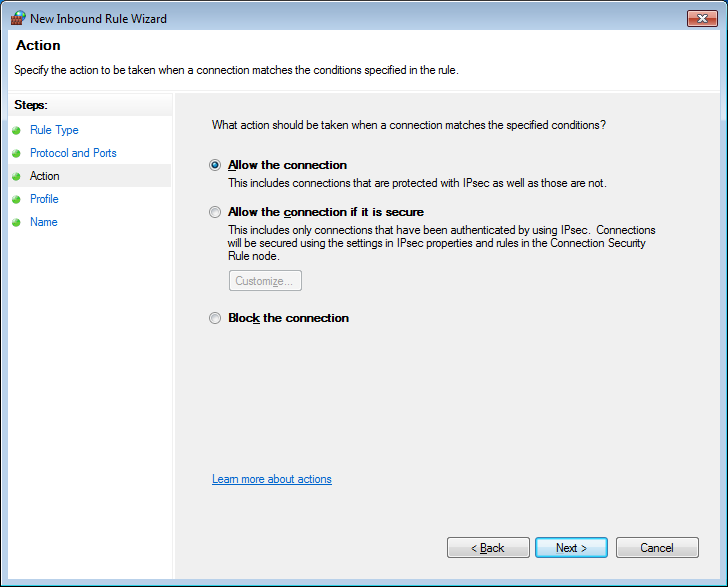
- Allow Remote Debugging Monitor application: Inbound Rules (on left side) | New Rule (on right-side) | Program | This program path | locate the path to the Remote Debugger Monitor e.g. msvsmon.exe | Allow the Connection | Domain=checked, Private=checked, Public=checked | provide any rule name you wish
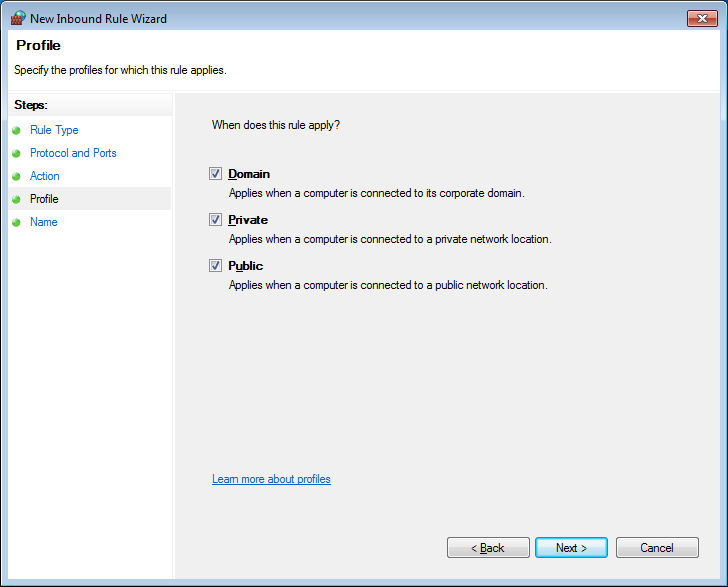
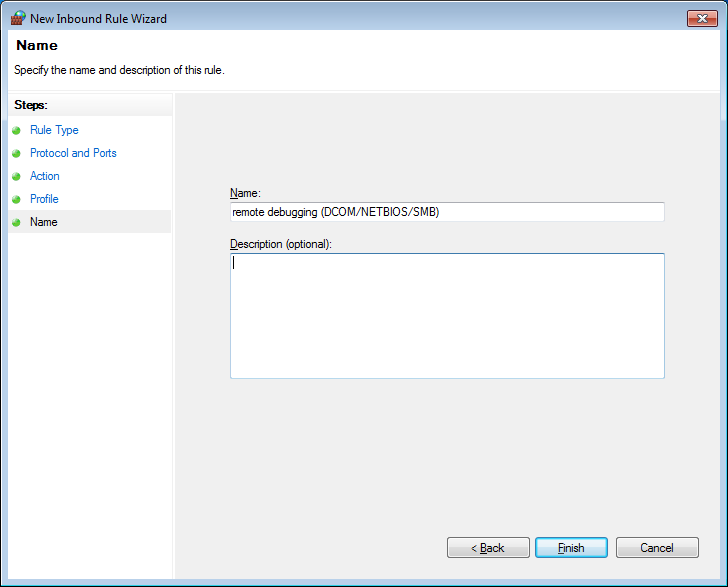
- Allow DCOM/NETBIOS/SMB services on port 135, 139, 445: Inbound Rules (on left side) | New Rule (on right-side) | Port | TCP | Specific Local Ports = 135,139,445 | Allow the Connection | Domain=checked, Private=checked, Public=checked | provide any rule name you wish
- Allow NETBOIS services on ports 137 and 138: Inbound Rules (on left side) | New Rule (on right-side)| Port | UDP | Specific Local Ports = 137,138 | Allow the Connection | Domain=checked, Private=checked, Public=checked | provide any rule name you wish
- Allow IPSec services on ports 500 and 4500: Inbound Rules (on left side) | New Rule (on right-side)| Port | UDP | Specific Local Ports = 500,4500 | Allow the Connection | Domain=checked, Private=checked, Public=checked | provide any rule name you wish
Now your remote debugging system is all configured. It’s time to setup a debug session.
Configuring a debug session:
Now that the one-time configuration of the host system running Visual Studio and the remote debugging system running the Remote Debugging Monitor is complete, you can setup a debugging session quickly and easily.
The general steps for starting a new debug session are:
- Build your project via Visual Studio (this ensures the latest code, symbols, and executable files are all in-sync and available)
- Copy the executable files and symbol files to the remote system
- Register/install all executable files necessary to your project on the remote system
- Launch the Remote Debugging Monitor utility on the remote system
- Launch your application on the remote system
- Attach the Visual Studio debugger on your host system to your running application on the remote system
You will repeat these six steps every time you create a new debug session. I recommend automating steps 2 – 5 via a batch file or Power Shell script. Not only will automation make the setup process quick, it will also make it less error-prone. As an additional side-benefit you can use the script as a source of documentation; making it easy to recall what files must be installed, registered, and started before a debug session for your specific project.
Each script you create will be unique to each project. Scripts will have commonality since they tend to accomplish the same actions (stopping services, copying files, registering services, starting the remote debugger, etc). Here is an example of a script I use after building my project with Visual Studio. It takes care of all the heavy lifting; making sure my project is configured on the target debug system.
echo on

REM *** stop my service if it’s currently running
net stop "Jojo Manager Service"

REM *** unregister the service with Windows
"C:\Program Files\Jojo\jojoserve.exe" /UnRegServer

REM *** copy all project files from host development system
REM *** to the local debug system. Including debug PDB symbol files
copy /Y "\\MyShare\Code\Projects\Jojo\jojoserve\Debug\jojoserve.exe" "C:\Program Files\Jojo\"

copy /Y "\\MyShare\Code\Projects\Jojo\jojoserve\Debug\jojoserve.pdb" "C:\Program Files\Jojo\"

copy /Y "\\MyShare\Code\Projects\Jojo\UI\WHSAddIn\bin\Debug\HomeServerConsoleTab.Jojo.dll" "C:\Program Files\Windows Home Server\"

copy /Y "\\MyShare\Code\Projects\Jojo\UI\WHSAddIn\bin\Debug\HomeServerConsoleTab.jojo.pdb" "C:\Program Files\Windows Home Server\"

copy /Y "\\MyShare\Code\Projects\Jojo\UI\WHSAddIn\obj\Debug\Interop.jojoserveLib.dll" "C:\Program Files\Windows Home Server\"

REM *** register the new debug version of the service
"C:\Program Files\Jojo\jojoserve.exe" /Service

echo off
pause
An example debug session:
Now that you understand the general configuration and flow of Remote Debugging and how to connect the host and target systems, let’s run-through an example of the remote debugging process.
- Build your project using Visual Studio
I recommend performing a full rebuild before a debug session. This will ensure you are running the latest code as well as getting the latest symbol and executable files.
- Run your automated batch file to copy and register project files
Copy your project executable (.exe and .dll) and symbol (.pdb) files to the remote debugging system. Ensure they are all re-registered with the operating system if necessary (e.g. COM objects, Windows services). See above to view a sample batch file to assist with copying and registering files. Note, if you are debugging a native executable then you do not need to copy the .pdb symbol files to the remote system; native symbol files are only required on the local host system.
- Launch the Remote Debugging Monitor utility on the remote system
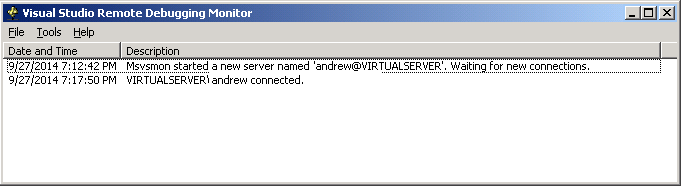
Locate the Microsoft Debugging utility named msvsmon.exe which you copied to the remote debugging system during the one-time setup. Double click to launch the Remote Debugging Monitor.
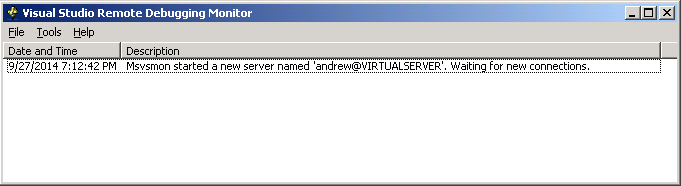
The remote system is now waiting for a connection from your host system running the Visual Studio debugger.
- Launch your application on the remote system
Launch your project executable on the remote system and return to your host system to establish the debug connection.
- Attach the Visual Studio debugger on your host system to your running application on the remote system
Return to the host system and open Visual Studio. From the main menu bar select Debug | Attach To Process…
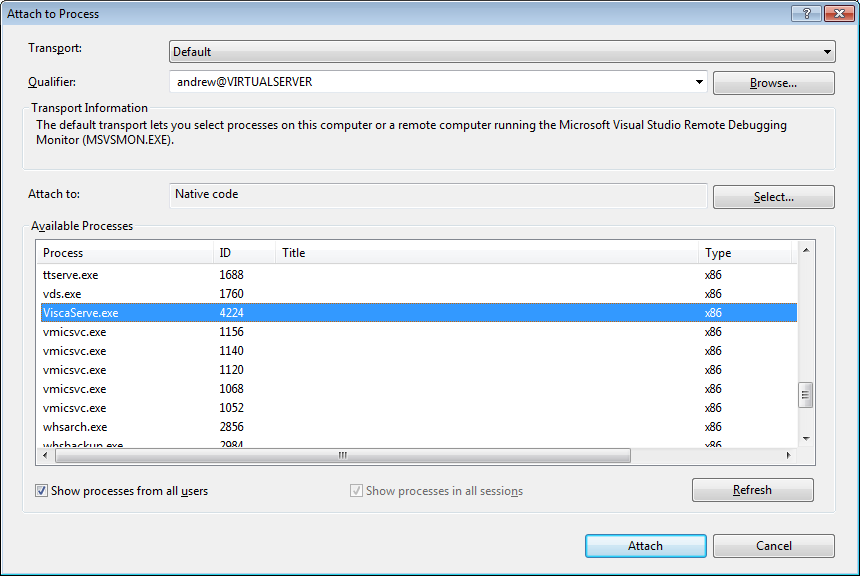
Select the following options to connect the Visual Studio debugger to the remote host:
Transport: set this value to “Default.”
Qualifier: this value specifies the name of the target debug system. Its full form is DOMAIN\USER_NAME@PC_NAME. If your local network uses a Domain then you must use the full syntax. If your local network does not use a domain then you can specify the name of the target PC (you can locate the PC name in the Remote Debugging Utility output window or via Computer | Properties | Computer Name). The user name is the name of the user logged into the remote system. You can find this name in the Remote Debugging Utility output window.
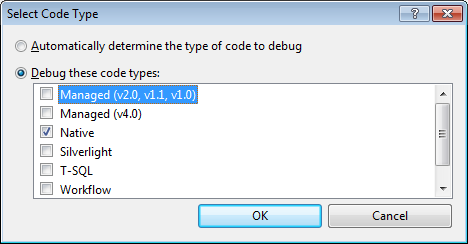
Attach To: press the Select button to specify the type of executable you are attaching to. For example, native, managed .NET 2x, or managed .NET 4x
Locate the name of the process you want to attach to. The Available Processes list-box will display all of the processes running on the target system specified in the Qualifier field
Select the process you have setup to debug on the remote system and press Attach. Visual Studio will then attach to the remote system and give you the ability to debug exactly like you would debug a local process. Very powerful!
As you can see, Microsoft Visual Studio offers a very powerful debugger allowing you to debug across multiple systems. Your first choice of debugging platforms will always be local but if that cannot be accomplished then rest assured, with a little bit of setup, you have access to the same debugging features across a remote system.
Tips:
- Keep a copy of the Remote Debug Tools on a local server share for easy access. If you develop for multiple systems then you’ll need to access various versions (x86, x64, ARM) of the tools. Easy access and setup are key to a happy day
- Use batch files or power-shell scripts to copy required files (exe, dll, symbols, etc) to the target PC and initialize your project requirements. If you create these scripts during your first debug session then you can use them as reference documentation in the future to easily recall which files are required to setup a debug session. Automating your development processes always make you more successful and less error prone
- Each version of Visual Studio includes its own version of the Remote Debugging Utilities so if you develop products with multiple versions of Visual Studio then keep multiple copies of the utilizes stored on an easily accessible network share
- Create an Administrator account on the target debugger machine with the same username and password that you use on your host development system. When remote debugging, log in with those credentials on the remote system. This makes the process of connecting your host and target much easier since you have the same account privileges on both systems
- Save hard drive space on the remote debugging system when debugging a native application. Symbol files (.pdb) for native applications only have to exist on the host system while symbol files for managed applications (such as C#) must exist on the remote debugging system in the same folder as the application. Don’t copy large .pdb files to the remote debugging system for your native components
- If you cannot create any break-points within Visual Studio after you have connected to your remote process then terminate the debug session (Debug | Terminate Process) then rebuild your project, copy all project and symbol files from your build to the remote system and reconnect the debugger. When attaching to the remote process, verify that you have the correct executable type (e.g. native, managed .NET 2x, managed .NET 4x, etc) set in the “Attach To” within in the Attach To Process box